
2026 Q2 -tulosraportti
UUTTA
5 päivää sitten
‧1 t 38 min
0,795 GBP/osake
Irtoamispäivä 6.8.
1,94%Tuotto/v
Tarjoustasot
Ei dataa
Viimeisimmät kaupat
| Aika | Hinta | Määrä | Ostaja | Myyjä |
|---|---|---|---|---|
| - | - | - | - |
Huomioi, että vaikka osakkeisiin säästäminen on pitkällä aikavälillä tuottanut hyvin, tulevasta tuotosta ei ole takeita. On olemassa riski, että et saa sijoittamiasi varoja takaisin.
Välittäjätilasto
Dataa ei löytynyt
Yhtiötapahtumat
Datan lähde: Quartr| Seuraava tapahtuma | |
|---|---|
2026 Q3 -tulosraportti 5.11. |
| Menneet tapahtumat | ||
|---|---|---|
2026 Q2 -tulosraportti 27.7. | ||
2026 Q1 -tulosraportti 29.4. | ||
2025 Q4 -tulosraportti 10.2. | ||
2025 Q3 -tulosraportti 6.11.2025 | ||
2025 Q2 -tulosraportti 29.7.2025 |
Asiakkaat katsoivat myös


Foorumi
Liity keskusteluun Nordnet Socialissa
Kirjaudu
 ·3 päivää sittenAstra's volatile price movements during the year are surely a dream for a TA expert, but I think SOBI has a significantly nicer chart, so I'm reweighting a little.
 The number of owners on Nordnet has increased from approx. 17500 3 years ago to over 21000 now and the highest number ever. Time for the share price to follow upwards.
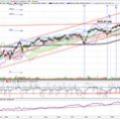 ·3 päivää sittenI can understand that the valuation cannot be based on the intrinsic value of AstraZ, but I am still quite surprised that a valuation between 1488kr and 2407kr is made. It's not much help for an amateur when trying to value this type of company. But it's mostly robots and algorithms that control the price of this company anyway! Therefore, TA becomes equally interesting, since robots and human behavior control the price! Short TA in daily view 29/7: Small gap formed 13 juli closed, but the larger gap from 9 juli is still open (1711kr-1848kr). Neg. signal MA50 down through MA200 24 juli, but the 200-line slightly upward. SMACD pos. signal at -10. Piercing Line signal 16 juli still unbroken. 1587kr still the lowest support. Volume balance slightly negative. Resistance at MA50 and MA200 lines (approx. 1725kr). Currently, the price is below all four MA lines, which creates resistance for an upward movement. The price is also below the Ichimoku cloud, which is another resistance. If the price breaks through the 200-line with increased volume, then perhaps the gap on 9 juli could be closed in the first stage. Now we'll see what algorithms and larger institutional players think about the stock...
- ·3 päivää sittenTotally fine to slowly grind upwards as long as the direction holds.
- ·28.7. · MuokattuCiti raises its price target for Astra Zeneca after report. The price target is raised to 178 pounds (2300 SEK) (175) after an upward revision of earnings forecasts by 1-3 percent, as well as positive phase 3 data for Sone-Ve. Citi estimates that Astra Zeneca will exceed its target of 80 billion dollars in revenue by 2030 and forecasts 83 billion dollars. Berenberg reiterates buy on pharmaceutical company Astra Zeneca and the price target of 160 British pounds. The bank stands by its forecast of 81 billion dollars in revenue by 2030 and highlights 25 important phase 3 results over the next 18 months. Berenberg estimates that the research portfolio can support growth even after 2030. Ålandsbanken reiterates its positive view on pharmaceutical company Astra Zeneca. The bank highlights that the company stands by its target of risk-adjusted revenue of 80 billion dollars by 2030 and estimates that larger acquisitions are not required to reach it. Goldman Sachs raises its price target for Astra Zeneca to 160:70 from 160:00 pounds. The buy recommendation is reiterated. This is stated in an update.

Yllä olevat kommentit ovat peräisin Nordnetin sosiaalisen verkoston Nordnet Socialin käyttäjiltä, eikä niitä ole muokattu eikä Nordnet ole tarkastanut niitä etukäteen. Ne eivät tarkoita, että Nordnet tarjoaisi sijoitusneuvoja tai sijoitussuosituksia. Nordnet ei ota vastuuta kommenteista.
Tämän sivun uutiset ja/tai sijoitussuositukset tai otteet niistä sekä niihin liittyvät linkit ovat mainitun tahon tuottamia ja toimittamia. Nordnet ei ole osallistunut materiaalin laatimiseen, eikä ole tarkistanut sen sisältöä tai tehnyt sisältöön muutoksia. Lue lisää sijoitussuosituksista.
2026 Q2 -tulosraportti
UUTTA
5 päivää sitten
‧1 t 38 min
0,795 GBP/osake
Irtoamispäivä 6.8.
1,94%Tuotto/v
Tämän sivun uutiset ja/tai sijoitussuositukset tai otteet niistä sekä niihin liittyvät linkit ovat mainitun tahon tuottamia ja toimittamia. Nordnet ei ole osallistunut materiaalin laatimiseen, eikä ole tarkistanut sen sisältöä tai tehnyt sisältöön muutoksia. Lue lisää sijoitussuosituksista.
Foorumi
Liity keskusteluun Nordnet Socialissa
Kirjaudu
- ·3 päivää sittenAstra's volatile price movements during the year are surely a dream for a TA expert, but I think SOBI has a significantly nicer chart, so I'm reweighting a little.The number of owners on Nordnet has increased from approx. 17500 3 years ago to over 21000 now and the highest number ever. Time for the share price to follow upwards.
- ·3 päivää sittenI can understand that the valuation cannot be based on the intrinsic value of AstraZ, but I am still quite surprised that a valuation between 1488kr and 2407kr is made. It's not much help for an amateur when trying to value this type of company. But it's mostly robots and algorithms that control the price of this company anyway! Therefore, TA becomes equally interesting, since robots and human behavior control the price! Short TA in daily view 29/7: Small gap formed 13 juli closed, but the larger gap from 9 juli is still open (1711kr-1848kr). Neg. signal MA50 down through MA200 24 juli, but the 200-line slightly upward. SMACD pos. signal at -10. Piercing Line signal 16 juli still unbroken. 1587kr still the lowest support. Volume balance slightly negative. Resistance at MA50 and MA200 lines (approx. 1725kr). Currently, the price is below all four MA lines, which creates resistance for an upward movement. The price is also below the Ichimoku cloud, which is another resistance. If the price breaks through the 200-line with increased volume, then perhaps the gap on 9 juli could be closed in the first stage. Now we'll see what algorithms and larger institutional players think about the stock...
- ·3 päivää sittenTotally fine to slowly grind upwards as long as the direction holds.
- ·28.7. · MuokattuCiti raises its price target for Astra Zeneca after report. The price target is raised to 178 pounds (2300 SEK) (175) after an upward revision of earnings forecasts by 1-3 percent, as well as positive phase 3 data for Sone-Ve. Citi estimates that Astra Zeneca will exceed its target of 80 billion dollars in revenue by 2030 and forecasts 83 billion dollars. Berenberg reiterates buy on pharmaceutical company Astra Zeneca and the price target of 160 British pounds. The bank stands by its forecast of 81 billion dollars in revenue by 2030 and highlights 25 important phase 3 results over the next 18 months. Berenberg estimates that the research portfolio can support growth even after 2030. Ålandsbanken reiterates its positive view on pharmaceutical company Astra Zeneca. The bank highlights that the company stands by its target of risk-adjusted revenue of 80 billion dollars by 2030 and estimates that larger acquisitions are not required to reach it. Goldman Sachs raises its price target for Astra Zeneca to 160:70 from 160:00 pounds. The buy recommendation is reiterated. This is stated in an update.
Yllä olevat kommentit ovat peräisin Nordnetin sosiaalisen verkoston Nordnet Socialin käyttäjiltä, eikä niitä ole muokattu eikä Nordnet ole tarkastanut niitä etukäteen. Ne eivät tarkoita, että Nordnet tarjoaisi sijoitusneuvoja tai sijoitussuosituksia. Nordnet ei ota vastuuta kommenteista.
Tarjoustasot
Ei dataa
Viimeisimmät kaupat
| Aika | Hinta | Määrä | Ostaja | Myyjä |
|---|---|---|---|---|
| - | - | - | - |
Huomioi, että vaikka osakkeisiin säästäminen on pitkällä aikavälillä tuottanut hyvin, tulevasta tuotosta ei ole takeita. On olemassa riski, että et saa sijoittamiasi varoja takaisin.
Välittäjätilasto
Dataa ei löytynyt
Asiakkaat katsoivat myös
Yhtiötapahtumat
Datan lähde: Quartr| Seuraava tapahtuma | |
|---|---|
2026 Q3 -tulosraportti 5.11. |
| Menneet tapahtumat | ||
|---|---|---|
2026 Q2 -tulosraportti 27.7. | ||
2026 Q1 -tulosraportti 29.4. | ||
2025 Q4 -tulosraportti 10.2. | ||
2025 Q3 -tulosraportti 6.11.2025 | ||
2025 Q2 -tulosraportti 29.7.2025 |
2026 Q2 -tulosraportti
UUTTA
5 päivää sitten
‧1 t 38 min
Tämän sivun uutiset ja/tai sijoitussuositukset tai otteet niistä sekä niihin liittyvät linkit ovat mainitun tahon tuottamia ja toimittamia. Nordnet ei ole osallistunut materiaalin laatimiseen, eikä ole tarkistanut sen sisältöä tai tehnyt sisältöön muutoksia. Lue lisää sijoitussuosituksista.
Yhtiötapahtumat
Datan lähde: Quartr| Seuraava tapahtuma | |
|---|---|
2026 Q3 -tulosraportti 5.11. |
| Menneet tapahtumat | ||
|---|---|---|
2026 Q2 -tulosraportti 27.7. | ||
2026 Q1 -tulosraportti 29.4. | ||
2025 Q4 -tulosraportti 10.2. | ||
2025 Q3 -tulosraportti 6.11.2025 | ||
2025 Q2 -tulosraportti 29.7.2025 |
0,795 GBP/osake
Irtoamispäivä 6.8.
1,94%Tuotto/v
Foorumi
Liity keskusteluun Nordnet Socialissa
Kirjaudu
- ·3 päivää sittenAstra's volatile price movements during the year are surely a dream for a TA expert, but I think SOBI has a significantly nicer chart, so I'm reweighting a little.The number of owners on Nordnet has increased from approx. 17500 3 years ago to over 21000 now and the highest number ever. Time for the share price to follow upwards.
- ·3 päivää sittenI can understand that the valuation cannot be based on the intrinsic value of AstraZ, but I am still quite surprised that a valuation between 1488kr and 2407kr is made. It's not much help for an amateur when trying to value this type of company. But it's mostly robots and algorithms that control the price of this company anyway! Therefore, TA becomes equally interesting, since robots and human behavior control the price! Short TA in daily view 29/7: Small gap formed 13 juli closed, but the larger gap from 9 juli is still open (1711kr-1848kr). Neg. signal MA50 down through MA200 24 juli, but the 200-line slightly upward. SMACD pos. signal at -10. Piercing Line signal 16 juli still unbroken. 1587kr still the lowest support. Volume balance slightly negative. Resistance at MA50 and MA200 lines (approx. 1725kr). Currently, the price is below all four MA lines, which creates resistance for an upward movement. The price is also below the Ichimoku cloud, which is another resistance. If the price breaks through the 200-line with increased volume, then perhaps the gap on 9 juli could be closed in the first stage. Now we'll see what algorithms and larger institutional players think about the stock...
- ·3 päivää sittenTotally fine to slowly grind upwards as long as the direction holds.
- ·28.7. · MuokattuCiti raises its price target for Astra Zeneca after report. The price target is raised to 178 pounds (2300 SEK) (175) after an upward revision of earnings forecasts by 1-3 percent, as well as positive phase 3 data for Sone-Ve. Citi estimates that Astra Zeneca will exceed its target of 80 billion dollars in revenue by 2030 and forecasts 83 billion dollars. Berenberg reiterates buy on pharmaceutical company Astra Zeneca and the price target of 160 British pounds. The bank stands by its forecast of 81 billion dollars in revenue by 2030 and highlights 25 important phase 3 results over the next 18 months. Berenberg estimates that the research portfolio can support growth even after 2030. Ålandsbanken reiterates its positive view on pharmaceutical company Astra Zeneca. The bank highlights that the company stands by its target of risk-adjusted revenue of 80 billion dollars by 2030 and estimates that larger acquisitions are not required to reach it. Goldman Sachs raises its price target for Astra Zeneca to 160:70 from 160:00 pounds. The buy recommendation is reiterated. This is stated in an update.
Yllä olevat kommentit ovat peräisin Nordnetin sosiaalisen verkoston Nordnet Socialin käyttäjiltä, eikä niitä ole muokattu eikä Nordnet ole tarkastanut niitä etukäteen. Ne eivät tarkoita, että Nordnet tarjoaisi sijoitusneuvoja tai sijoitussuosituksia. Nordnet ei ota vastuuta kommenteista.
Tarjoustasot
Ei dataa
Viimeisimmät kaupat
| Aika | Hinta | Määrä | Ostaja | Myyjä |
|---|---|---|---|---|
| - | - | - | - |
Huomioi, että vaikka osakkeisiin säästäminen on pitkällä aikavälillä tuottanut hyvin, tulevasta tuotosta ei ole takeita. On olemassa riski, että et saa sijoittamiasi varoja takaisin.
Välittäjätilasto
Dataa ei löytynyt